
Site Performance Analysis: A Practical Guide
Site performance analysis is the process of measuring how quickly, reliably and smoothly a website works for its visitors. It helps businesses identify technical problems, understand how people experience their site and decide which improvements are likely to make the greatest difference.
A slow or unreliable website can frustrate visitors, make important information harder to find and interrupt tasks such as making a purchase or submitting an enquiry. Regular analysis helps teams spot issues early and keep a site working well as its content, features and audience grow.
What does site performance include?
Performance is about more than how quickly a page appears to load. A useful analysis considers several aspects of the experience:
- Loading speed: How quickly the main content becomes visible and usable.
- Responsiveness: How promptly the site reacts when someone taps a button, opens a menu or enters information.
- Visual stability: Whether page elements stay in place as the page loads, rather than shifting unexpectedly.
- Reliability: Whether pages and features work consistently across different devices, browsers and network conditions.
- Accessibility and usability: Whether people can navigate and use the site effectively, including with assistive technology.
Why analyse site performance?
Analysis provides evidence for improving a website. Rather than relying on guesswork, a team can use measurements and user behaviour to find out where delays or errors occur. This can help prioritise work, particularly when development time or budgets are limited.
Performance can also affect business outcomes. If a key page takes too long to load or a form fails on mobile, visitors may abandon the task. Improving the experience can make it easier for people to find information, contact a business or complete a transaction. Performance is only one part of a successful website, however; it should be considered alongside content quality, design, accessibility and relevance.
Key metrics to monitor
The most useful metrics depend on the purpose of the site. A content website, online shop and booking service may each have different priorities. Common measures include:
- Largest Contentful Paint (LCP): Measures when the largest visible content element has loaded. It can indicate whether the main content appears promptly.
- Interaction to Next Paint (INP): Measures how quickly a page responds visually to user interactions.
- Cumulative Layout Shift (CLS): Measures unexpected movement of content while a page is loading.
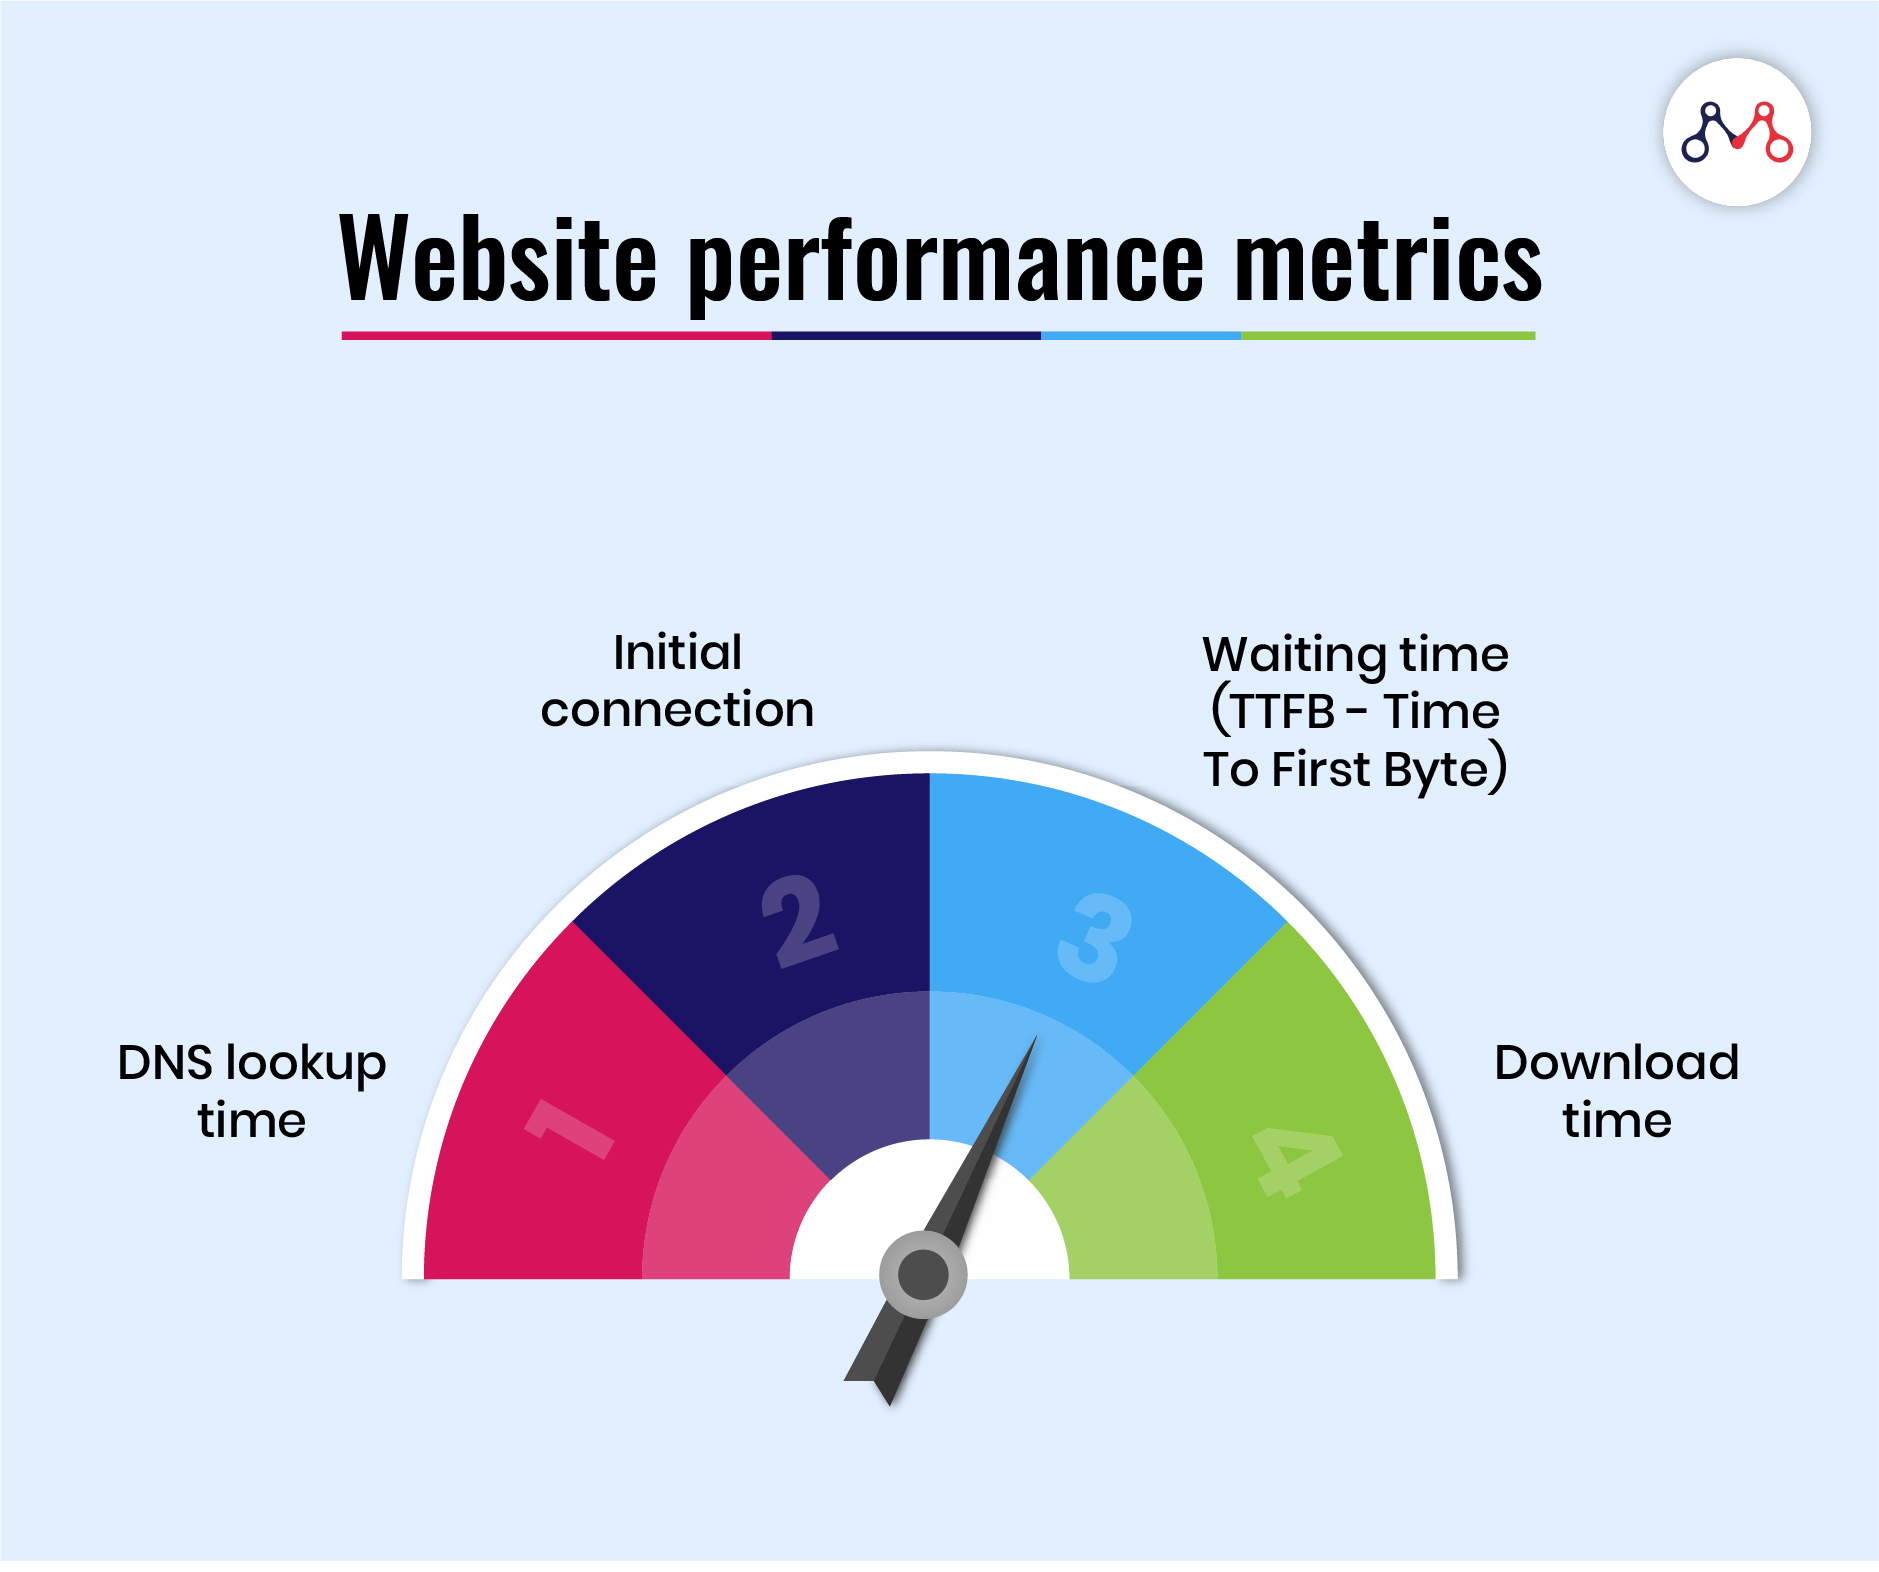
- Time to First Byte (TTFB): Measures the time between a browser requesting a page and receiving the first byte of the response.
- Error rate: Tracks failed requests, broken pages and problems with important features.
- Conversion and task completion: Shows whether visitors are able to complete actions such as purchasing, registering or submitting a form.
These measurements should be interpreted together. A good score in one area does not guarantee a good experience overall, and a metric alone rarely explains the cause of a problem.
Lab tests and real-user data
Performance analysis commonly uses two kinds of data. Lab tests run in a controlled environment, making them useful for repeatable checks and diagnosing changes. They can be carried out during development or after updates.
Real-user monitoring collects performance information from actual visits, subject to appropriate privacy practices and consent requirements. It can reveal how the site behaves across a wider range of devices, locations and network conditions. Lab results and real-user data can differ, so using both provides a more complete picture.
A practical process for analysing performance
- Set a clear objective. Decide what needs to improve, such as mobile loading, checkout reliability or the time it takes for an enquiry form to respond.
- Choose representative pages. Include important landing pages, high-traffic content and key steps in user journeys—not just the homepage.
- Measure a baseline. Record current results using consistent tools and test conditions. Where possible, include both mobile and desktop.
- Look for patterns. Compare pages, devices and user journeys to identify where problems are most frequent or most damaging.
- Investigate the cause. Check images, scripts, fonts, server response, third-party services and page structure. Avoid changing several things at once if it makes results harder to understand.
- Prioritise improvements. Start with issues that affect many visitors or block important tasks, then consider the effort required to fix them.
- Test and measure again. Recheck after each significant change to confirm whether it helped and ensure that other features still work.
- Keep monitoring. New content, software updates and integrations can affect performance, so analysis should be ongoing rather than a one-off exercise.
Common causes of poor performance
Slow pages often have several contributing factors. Large, uncompressed images can take a long time to download, while excessive scripts may delay rendering or make interactions less responsive. Other common causes include slow server responses, inefficient code, too many third-party tools, render-blocking resources and a lack of caching.
Visual instability may be caused by images or advertisements without reserved dimensions, late-loading fonts or content inserted above existing elements. Reliability problems can stem from broken links, failed API requests, outdated software or features that have not been tested across different browsers and devices.
Turning findings into improvements
Once a problem has been identified, focus on changes that address its root cause. Image optimisation may involve choosing suitable formats, resizing files to match their display dimensions and compressing them without unacceptable loss of quality. Developers may also reduce or defer non-essential JavaScript, improve caching, streamline page templates or review the need for third-party services.
Every change should be checked against the original objective. For example, reducing the number of scripts may improve responsiveness, but it is important to confirm that analytics, forms and other essential features continue to work. Performance improvements should not come at the expense of accessibility, security or useful content.
Choosing the right tools
A range of tools can support site performance analysis, from browser developer tools to automated testing services and real-user monitoring platforms. Some provide quick assessments, while others offer detailed diagnostics or ongoing reports. Select tools that suit the site’s technical setup and the questions being investigated, and use consistent testing methods when comparing results over time.
Automated scores are helpful indicators, but they should not replace testing the site as a real visitor would. Check key journeys manually on different screen sizes and consider testing under slower network conditions. This can uncover practical issues that a summary score may not explain.
Conclusion
Site performance analysis helps organisations understand how their websites behave and where improvement is needed. By setting clear goals, monitoring meaningful metrics and combining controlled tests with real-user evidence, teams can make informed changes and measure their impact. Regular review keeps performance aligned with visitors’ needs as the website develops.
8 Essential Tips for Analysing Website Performance
- Set a performance baseline before making changes.
- Measure real-user experience across devices and networks.
- Track Core Web Vitals over time.
- Use browser developer tools to find bottlenecks.
- Check server response times and caching.
- Optimise images, fonts and scripts.
- Test key pages, not just the homepage.
- Compare results after each change.
Set a performance baseline before making changes.
Before making changes to a website, record a performance baseline so you have a clear picture of how it performs today. Measure key pages on both mobile and desktop, and note relevant figures such as loading speed, responsiveness, layout stability and error rates. Use consistent tools and testing conditions, as results can vary. Once an update is complete, repeat the tests and compare the results with your baseline. This helps you see whether the change has improved performance, caused new issues or made little difference.
Measure real-user experience across devices and networks.
Measure real-user experience across a range of devices and network conditions to understand how your site performs beyond controlled tests. Visitors may use older phones, different browsers or slower mobile connections, so a page that loads quickly on a desktop may feel sluggish elsewhere. Real-user data can reveal where delays, layout shifts or unresponsive interactions affect people most, helping you prioritise improvements that make the experience faster and more reliable for everyone.
Track Core Web Vitals over time.
Track Core Web Vitals over time to see how your website performs for real visitors and whether changes are making a difference. Monitor Largest Contentful Paint (LCP), Interaction to Next Paint (INP) and Cumulative Layout Shift (CLS) regularly, rather than relying on a single test. Compare results across key pages and devices, and investigate sustained declines or sudden changes. Ongoing tracking can reveal the effects of new content, code updates or third-party tools, helping you prioritise improvements that keep the site fast, responsive and visually stable.
Use browser developer tools to find bottlenecks.
Use your browser’s developer tools to identify what is slowing a page down. The Network panel shows how long files take to load and highlights large resources or delayed requests, while the Performance panel can reveal scripts, rendering tasks or layout changes that affect responsiveness. Test key pages on mobile as well as desktop, and use the findings to prioritise fixes such as optimising images, reducing unnecessary scripts or improving server response times.
Check server response times and caching.
Check server response times and caching to identify delays that occur before a page begins to load. A slow response may point to issues such as overloaded hosting, inefficient database queries or unnecessary server-side processing. Caching can help by storing copies of frequently requested pages and resources, reducing the work the server needs to do and speeding up repeat visits. Review caching settings regularly to ensure content stays up to date, and compare results before and after making changes.
Optimise images, fonts and scripts.
Optimising images, fonts and scripts can make a website faster and smoother to use. Resize and compress images, and choose efficient file formats so pages do not download more data than necessary. Use only the font styles and weights you need, and consider loading fonts efficiently to avoid delays or layout shifts. Review scripts regularly, remove unnecessary code and defer non-essential scripts so they do not slow down the main content or prevent visitors from interacting with the page.
Test key pages, not just the homepage.
Test key pages, not just the homepage, because visitors often arrive directly at product pages, articles, service information or checkout. These pages may use different layouts, images and features, so their performance can vary considerably. Testing the pages that attract the most visitors or support important tasks helps uncover issues that could otherwise be missed and makes it easier to prioritise improvements where they matter most.
Compare results after each change.
Compare performance results after each change to see whether an update has made a genuine difference. Use the same tools, pages and testing conditions where possible, and review key measures such as loading speed, responsiveness and visual stability. Checking changes individually makes it easier to identify what worked, spot unintended effects and decide what to improve next.